The Dashboard
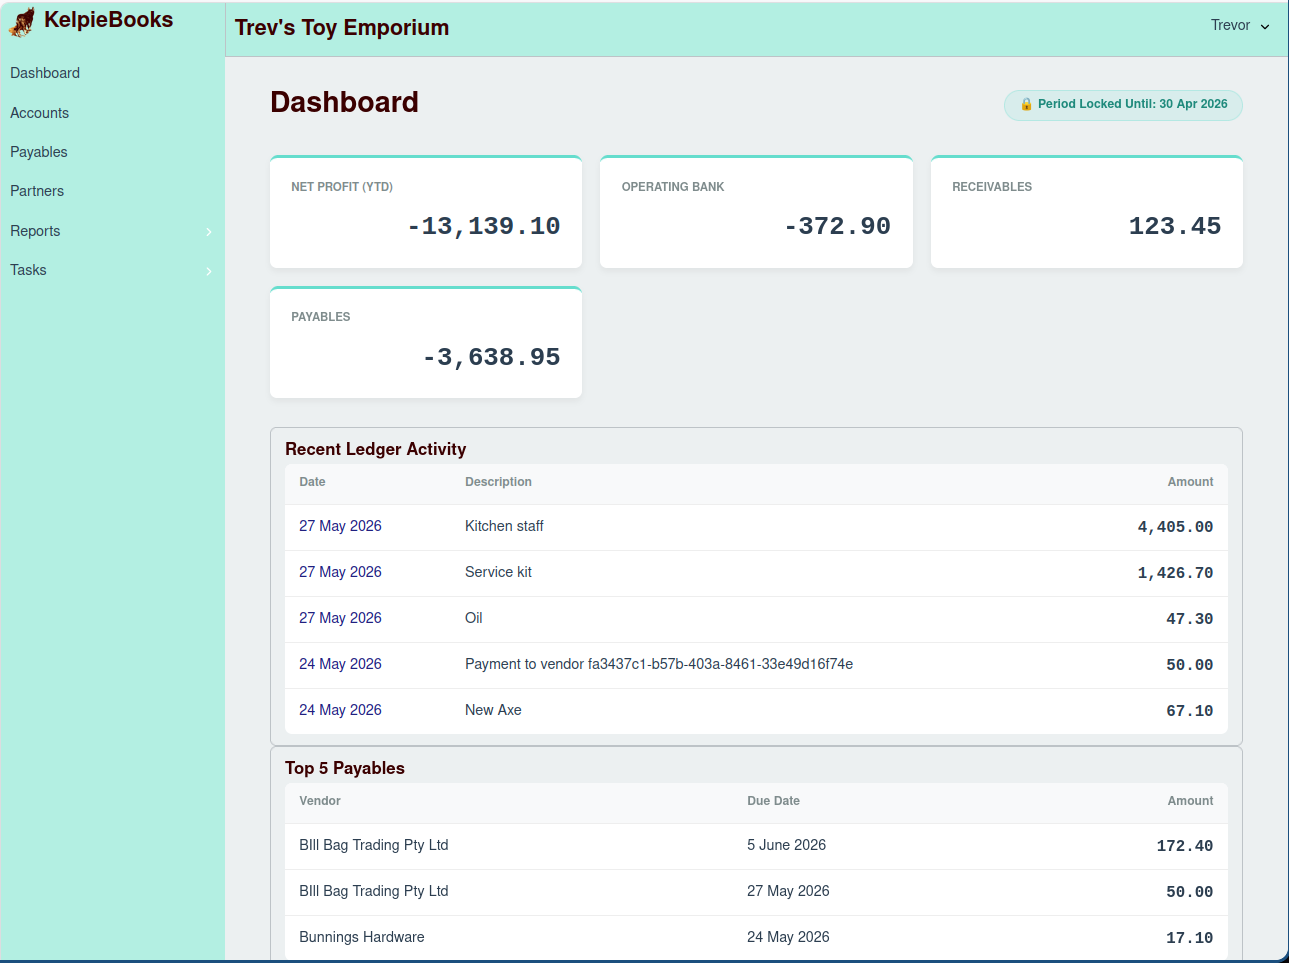
The Dashboard is the first screen you see when you log into KelpieBooks. It provides a high-level overview of your business's financial health at a glance.
Key Metrics
The top section of the dashboard displays several key financial metrics:
- Net Profit (YTD): This shows your company's net profit for the current financial year to date. It's a quick way to gauge your profitability.
- Operating Bank: This displays the current balance of your primary operating bank account.
- Receivables: This is the total amount of money that customers owe you.
- Payables: This is the total amount of money that you owe to suppliers.
Period Status
Just below the main title, you'll see the status of the current accounting period.
- 🔓 Period Open: This means that you can create, edit, and delete transactions.
- 🔒 Period Locked Until: {date}: This indicates that the accounting period is locked, and no transactions on or before the specified date can be modified. This is a crucial feature for maintaining the integrity of your financial records after a period has been closed.
Visualizations
The dashboard also includes several charts and lists to help you visualize your financial data:
- Recent Ledger Activity: This is a chronological list of the most recent transactions that have been entered into the system. It's a great way to keep track of daily financial activities.
- Top 5 Payables: This chart displays the top five outstanding bills you need to pay, helping you prioritize your payments.